Or, that time a single column update crashed our app

A while back, a single class of jobs took down all of our async processes due to Out Of Memory problems. I told you how we prevented the general problem of a single class of jobs halting all of our async work. Now we’ll dive into how a class of jobs that had been happily running every night for years suddenly threw a temper tantrum and broke everything.
Something’s wrong.
From an investigation into a larger incident, we discovered that a class of asynchronous job was using a huge amount of memory and taking down its container. I’ll call that class of job “DisasterJob.” We needed to reduce the memory this job needed to run, which meant figuring out what was causing the high memory usage in the first place.
All the info we had
This was everything I knew going into the investigation:
- DisasterJob was old code: it had been written 3 years ago, and had run every night since.
- DisasterJob’s primary purpose was to look at Benefit Applications in our system and update the start date for the benefits on those applications if the original start date was no longer feasible. E.g. if the Benefit Application originally had a start date of 12/1/2018 when it was created on 11/5/2018, but time had passed and today’s date was now 12/2/2018, we’d update the start date to 1/1/2019 instead.
- If DisasterJob didn’t run, customers might accidentally sign up for the wrong benefits due to an incorrect start date.
I didn’t know much beyond that, and neither did anyone else. The people who originally wrote and reviewed the code had either left the company or forgotten what they did 3 years prior.
Where to start? Repro!
Given that nobody knew what the code was actually doing, it was impossible to just make an educated guess around where the problem was coming from and try to fix it. I tried running the code in my local rails console to see if I could reproduce the issue:
> DisasterJob.new.perform(args)
=> true
Ok, so… it worked? But I had no clue what the memory usage was.
Time to use a profiler!
After a bit of Googling, I decided to use the memory_profiler gem. It was pretty straightforward to run.
require "memory_profiler"

memory_report = MemoryProfiler.report do
    DisasterJob.new.perform(args)
end

memory_report.pretty_print
… but whoa was that output huge! The gem prints out lots of sections, including “allocated memory by gem”, “allocated objects by class”, “allocated memory by file”, and much more. I didn’t know which part of the report to look at! But I did know I didn’t want it all dumped into my terminal, so I changed the config to print to a file:
require "memory_profiler"

memory_report = MemoryProfiler.report do
    DisasterJob.new.perform(args)
end

memory_report.pretty_print(scale_bytes: true, to_file: “my_report”)
The beginning of the output file named “my_report” looked like this:
Total allocated: 736968 bytes (8013 objects)
Total retained:  72855 bytes (684 objects)

allocated memory by gem
-----------------------------------
    221032  binding_of_caller-0.8.0
    190321  activesupport-4.2.10
    122840  contracts-0.11.0
     87985  activerecord-4.2.10
     75424  my_repo/app
...
...
...
Cool, numbers!

But how to make the numbers go down? 🤔
Again, I didn’t know much about how the guts of the code worked, and didn’t know if the memory usage listed was good or bad. In fact, I didn’t even know what category of memory usage the report listed was important! I decided to run the code over and over, with different parts commented out each time, and compare the first numbers I saw.
I ran into a bit of trouble the second time I ran DisasterJob. It was so fast and hardly used any memory! I realized that my first run of DisasterJob had, well, done its job: The start date on the BenefitsApplication was appropriately set to being in the future. The second run early exited because the BenefitsApplication no longer needed to be updated. Instead of finding a new BenefitsApplication to update each time I ran the code, I put the code in a transaction so that I could easily rerun the job without worrying about having to find new data each time:
require "memory_profiler"

memory_report = nil # define the var outside of the transaction block to retain access
ActiveRecord::Base.transaction(joinable: false, requires_new: true) do
    memory_report = MemoryProfiler.report do
        DisasterJob.new.perform(args)
    end

    raise “Don’t actually save!”
end

memory_report.pretty_print(scale_bytes: true, to_file: “my_report”)
Then I started commenting out lines. I took the first few numbers the report gave me for a few runs and put them in a simple spreadsheet:
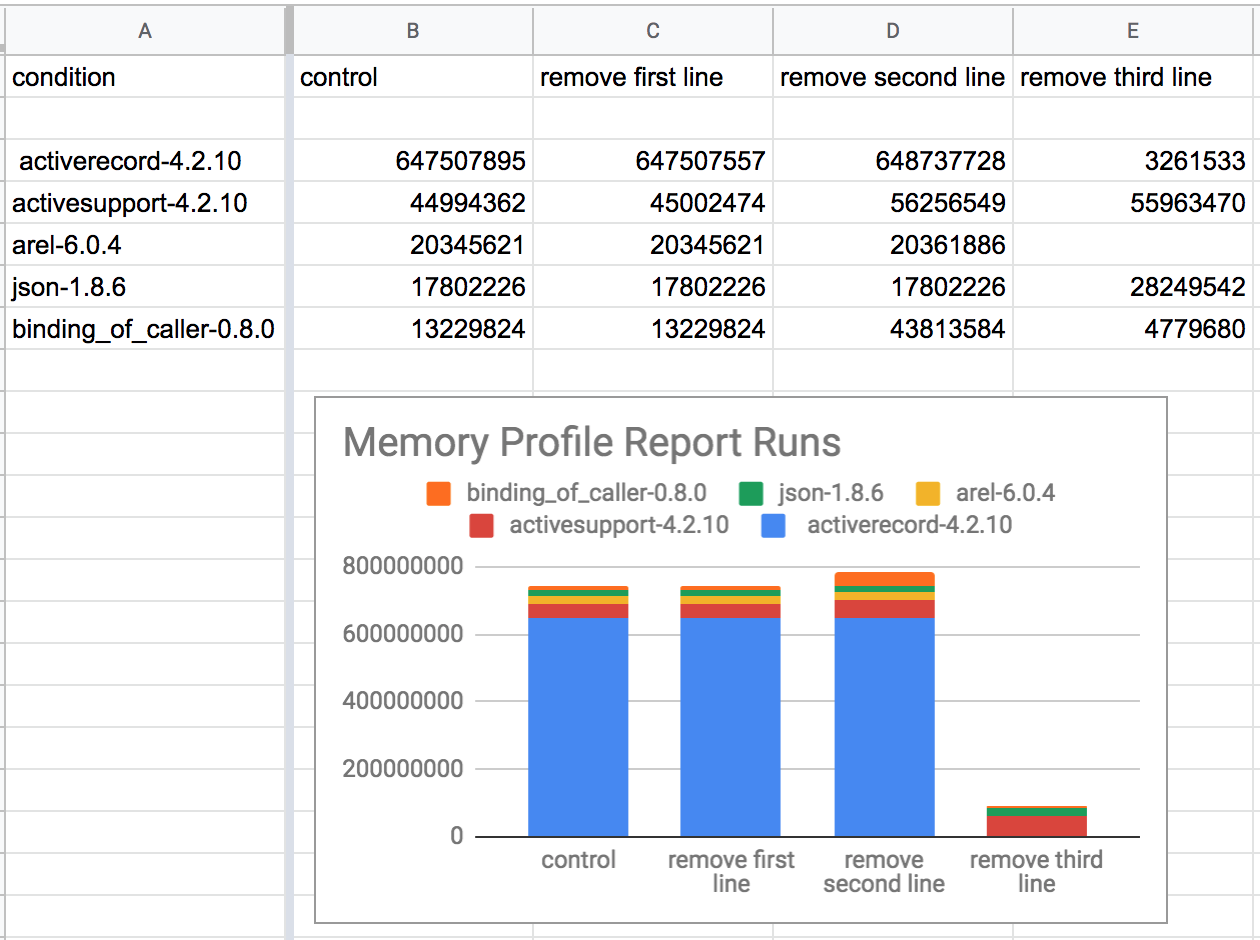
Whoa. The chart above has a bar for the memory usage of DisasterJob (1) unchanged, (2) with the first line of its code removed, (3) with the second line of its code removed, and (4) with the third line of its code removed. The last bar is way smaller than the others, meaning that removing the third line of DisasterJob’s code somehow shrunk its memory usage by 80%. I don’t know what that third line was doing, but it looks like it caused most of the code’s memory usage!
Inspecting further, I found that the third line was a method that called a few other methods itself, so I repeated this commenting-out-and-rerunning-the-profiler process. I tried to comment out half of a method at a time and then narrow or expand which lines were commented from there. In short, I was binary-searching DisasterJob’s codepath for low memory usage.
Eventually, I got something like this:
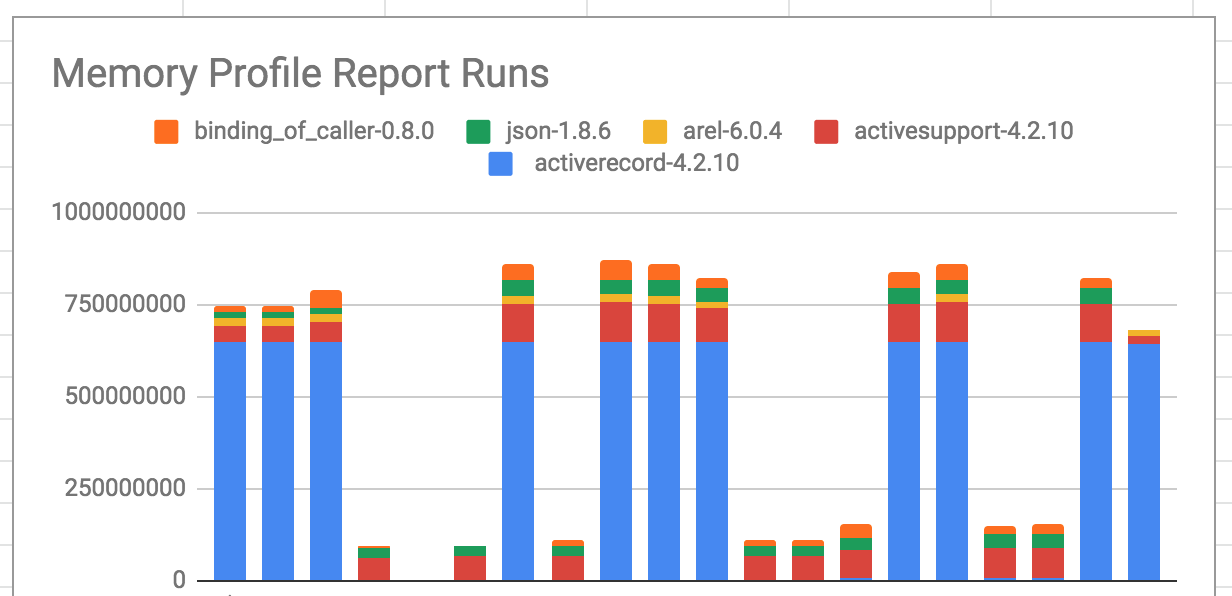
I was able to confirm that commenting out one single method call, which did not delegate to any other methods, dropped the “total allocated memory” volume from ~0.75gb to ~.15gb. In particular, it dropped ~0.6gb of activerecord usage to nearly nothing!
The culprit? A simple column update:
BenefitApplication.update!(start_date: new_start_date)
WHAT. Why is a single column update using that much memory?
I wondered the same thing, dear reader. After a few ~hours~ days of headbanging, I sleuthed out the true culprit: a before_save callback on the BenefitApplication model. 😱
It turned out that before saving that simple start date update, our code was running a method that made an extremely expensive query[1]. If you remember, DisasterJob’s purpose was to push the start date for BenefitApplications forward. The expensive query in the BenefitApplication model was being used to find data about health insurance plans on the new date. In the benefits industry, thousands of new benefits plans are introduced each calendar year. This meant that when BenefitApplications were pushed to a start date in a new calendar year, a lot of new data was added to the inefficient query. Each time we ran DisasterJob, all of the health insurance plans in our system were being grouped and analyzed, even if they had expired years ago.
I scoped down the data we were querying to a much smaller and more relevant subset before running calculations on it. I filtered out expired health insurance plans or plans that weren’t applicable to the company that was applying for benefits. This resulted in pulling a lot less data into memory.
Nice. Are you sure it worked?
Yup! With my code change, DisasterJob ran using ~.35gb of local memory instead of ~.75gb and still accomplished its task. Plus, when we re-enabled DisasterJob in the production environment, it ran without error.
Yay! But why didn’t DisasterJob have this problem any other time in its three year history?
Good question! It just so happened that the run of DisasterJob on this day caused an update to a lot of BenefitApplications, resulting in a particularly inefficient data query compared to any day before.
Cool! How should I use this info?
Get familiar with the memory profiler gem, and always think critically about your DB queries. I would even recommend running a few of your common codepaths and async jobs through a memory profiler and a speed profiler. You might find a way to make a huge improvement!
In the course of the investigation, I discovered that the expensive query wasn’t even working properly. Yikes! Luckily the fix for the memory allocation also fixed the correctness of the query. ↩︎


