First step in understanding your customers

Growth engineering is a crucial aspect of any expanding company. There are many components that go into doing Growth Engineering well. For the past 7 years, I have been working on Growth engineering, building the team, tools, and foundational platform required to grow our customer base.
This is the first post in a series of articles that goes over what it takes to build a growth platform that can power a SaaS company. We will start with Instrumentation and Analytics, the source of all user insights and the foundation of any growth platform.
Before we get into the details on instrumentation, let's take a step back and talk about privacy and consent. This article talks about capturing analytical data that's derived from user behavior. Whenever data is captured care must be taken that the data capture conforms to the companies privacy policies and regulations concerning user data and privacy. Gusto's philosophy is to be a data custodian and not a data owner. Gusto data privacy policy can be viewed here
There are some crucial questions to ask when considering running growth experiments.
- Do you know your customers?
- Do you know how they enter your funnel?
- What parts of your marketing website or application do they interact with?
In order to answer these questions, or even come up with a hypothesis as a basis for experimentation, we need to collect some data. We need to instrument our software to collect analytical information.
What does analytic information look like?
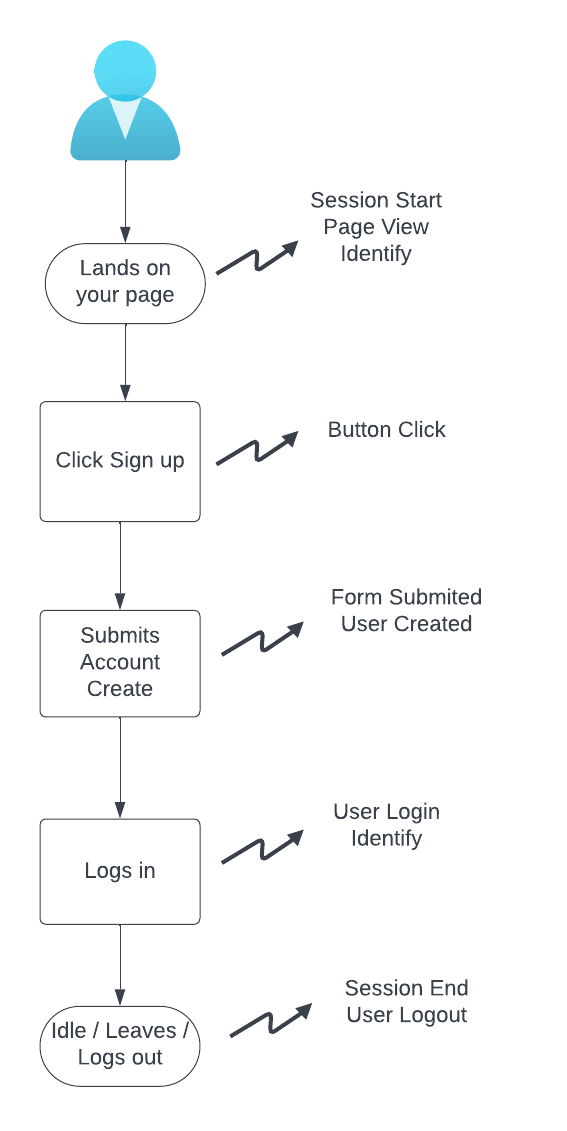
- Visitor Anon1 lands on the homepage via a google search click
- Visitor Anon1 clicks on Sign up button at top left of the nav bar
- Visitor Anon1 Submits Account Create Form
- Visitor Anon1 is now User UUID 747374-232332….
At first anyone on your website is just an anonymous visitor. Only once they login or sign up do they become a registered user.
How do we get this information?
We get this information by sending analytic events for every touch point we want to measure. An event name is usually a noun ( the what ) followed by a verb ( the action ). These touch points can be an interaction on the UI:
- Page Viewed
- Button Clicked
Or something done on the backend:
- Bill Paid
- Task Completed
Here is an illustration of common interactions that might trigger analytics data tracking.
This information then gets stored in a format that is easily queryable to generate insights into how customers interact with our pages.
Analytics events usually follow a schema. At a minimum it has an eventName. The schema contains a user identifier, which could either be an anonymous id or a user id for a known user, in addition to other event attributes.
Here is an example of a typical analytics event schema.
{
    "$schema": "https://json-schema.org/draft/2019-09/schema",
    "title": "Event",
    "type": "object",
    "properties": {
        "eventName": {
            "type": "string"
        },
        "anonymousId": {
            "type": "string"
        },
        "userId": {
            "type": "string"
        },
        "appName": {
            "type": "string"
        },
        "url": {
            "type": "string"
        },
        "userAgent": {
            "type": "string"
        },
        "timestamp": {
            "type": "number"
        },
        "properties": {
            "type": "object"
        }
    }
}
Now that we know what events look like, let's look at how we can get this information. We’ll start with a simple strategy to acquire analytics data and walk through the growth process to forming a mature event pipeline.
Evolution of your instrumentation and Analytics Platform
The first place companies typically start to instrument is their marketing website, in order to measure what drives traffic to the site. A quick way to start doing this is by using Google Analytics. Google Analytics is a Javascript tag that can be added to the website. Google Analytics captures visitor interactions and provides tools to analyze traffic sources.
Google Analytics is a great start for measuring visitor count, tracking the number of sessions, identifying where traffic comes from via the referrer, and pinpointing the source geolocation. Google analytics also measures unique page views and UTM parameters, giving us insight into marketing campaigns.
Privacy-minded browsers will block Google Analytics. Firefox will block Google Analytics by default, which means we miss out on analyzing a sizeable number of visitors to your site. User privacy is important and needs to be respected. When it comes to instrumentation it needs to be done without violating user privacy.
After getting basic marketing data, it’s time to build custom events to track usage of the application. This can be done via 3rd party analytics tools like Amplitude or Mixpanel. These SaaS providers offer an SDK that sends custom analytic events. There is both a javascript SDK for the frontend and an SDK for the language of your choice in the backend.
These tools capture page views automatically for server rendered pages or as needed if building a single page application. They also provide an api for sending custom events that can be used anywhere in the application to capture a key moment in the workflow.
After establishing events, we need to attribute each event to a user. A user can be an anonymous visitor on your public facing website or a known user that has logged in. Passing an anonymous id for the visitor and a customer id for a known customer allows the backend to stitch together a user’s interactions to tell a holistic story. Best practice is to use a UUID for these ids.
Bigger companies may feel the need to have multiple places to store and analyze event data. Companies with data and business intelligence (BI) teams may build their own enterprise data warehouse (EDW) for internal teams to query data. Marketing teams may also need the analytics data in martech tools to measure conversion and funnel attribution.
At this point, it is time to consider an event router. An event router will pipe events to the different places they are needed.
Popular event routing vendors like Segment and Tealium take data and allow the admins to create routing rules or enrich the data before forwarding them to data sinks. Data sinks can be 3rd party apis, visualization tools, data stores, ad networks etc. These vendors have built products that have evolved into being customer data platforms (CDP).

If third party vendors are not a good fit, it’s possible to build your own analytics pipeline! A good way to do this is to use open source technologies and host everything in house. An analytics pipeline consists of a stream of events which can then be acted upon, modified or filtered and sent to consumers of events. Create an event stream for the analytics and process this stream according to your needs along with federating these events to downstream consumers. Event streaming technologies like AWS Kinesis or Kafka can help here. A highly available analytics server is required to accept events and push them to the streaming pipeline.
Stream processors are functions that act on the streaming data. A list of stream processors can enrich the events with data and push them to the different data sinks. AWS firehose allows you to store all your events to S3 which can then be queried by your in house EDW. Of course you need to store this data in a format like parquet for efficient querying of the data.
After years of work, the Gusto analytics pipeline has matured into a robust system. It has been great to see this evolve over time, from a simple system that gave us valuable initial insights to a robust system that follows analytics best practices.
Analytics Best Practices
Server side events V/S client side events
Favor server side events over client side events. If using client side events, sending events to an endpoint on the same domain will help ensure they don’t get blocked by ad blockers. One thing to watch out for server side events is to discard events from bots, synthetic tests, crawlers. These are not real users and they will pollute your data
Analytics is not Monitoring
Analytics is not monitoring. Monitoring is used to measure the health of your application. Monitoring systems detect errors and measure both performance and availability metrics. Analytics helps us understand how users interact with the software. Do not fall into the trap of mixing analytics and monitoring into a single system. Pushing user data into your monitoring systems will lead to your metrics having high cardinality ( unique timeseries ) which is inefficient and expensive. Overloading your analytics pipeline with performance metrics pollutes your user analytic data with system information which is not relevant to user behavior. It increases event volume and can use up the vendor event volume budget.
Cookie and user consent
Always honor user consent. If users don't want to be tracked, do not track them! The purpose of analytics data is to understand usage patterns and measure user interactions. This can be accomplished with users that provide consent.
PII / PHI
It should not be possible to identify users via an analytics system. Never send any PII / PHI data through an analytic system. Use UUIDs for events and prepare a data deletion strategy that complies with privacy laws like GDPR and CPRA
3rd party vs building your own
Using a vendor can enable companies to more quickly begin analytics tracking. However, vendor costs also scale with event volume. Third parties get expensive once data volume increases.
For midsize companies, building an analytics pipeline from scratch starts to make more sense. Sending data to your own servers minimizes loss. Analyzing data in your own data lake maintains low costs and keeps data in house.
Event Loss / Latency
Analytics events can be lossy and are usually not latency sensitive. They should be asynchronous to the working of your webapp. However, care should be taken to minimize loss where possible. Latency of data must be reasonable for business needs. This allows for near real time analysis of critical analytics data.
Data Quality & Schema
Data quality is critical. Without accurate data, we cannot make smart decisions. I have personally witnessed many ways in which companies' data becomes junky over time due to a lack of schemas, enforcement, and event definitions.
Having a schema for analytics events upfront will ensure all events and their properties have the same shape and structure . Adding schema validation in the build pipeline or analytics pipeline will prevent bad data from going through and ensure the quality of the event stream
After schema validation comes a tracking plan. A tracking plan is a way to define what the purpose of the events are and what metrics they will help measure. An easy way to get started with a tracking plan is with a spreadsheet. The tracking plan contains the metrics / workflows that are to be measured. It also contains the moments to be captured for that metric or workflow followed by the definition of events for those moments. The events can be new events or existing events that have contextual attributes.
The tracking plan provides documentation to product managers and data analysts on how application workflow and metrics are measured and instrumented. There are also 3rd party tools in this space like avo and tracking plan that can be better than spreadsheets.
Conclusion
At Gusto we have a sophisticated analytics pipeline that is run by our data team along with an in house EDW as well as 3rd party visualization tools. Growth and product teams use this data to make informed decisions and measure success of feature launches and experiments. Hope this blog helps you understand the fundamental tools for Growth and how to leverage analytics to understand how users interact with your site to make the best product decisions.
See the next article in the blog series here.

