Let me explain something right away: what I’m going to talk about is pretty unique to our application. If you don’t have an application like ours, then what I’ve written here might not help you. Our application is very big (3.8 million lines of Ruby), and has 10 years of history. If you skip to the end, and just apply the solution, it might not do anything for you. It could even make things worse! But, I hope that everyone can learn something from this story about how we made our tests faster.
With that in mind, here's the story.
Bug Report: Hanging in "Rack"
I often work with the Product Infrastructure team at Gusto. This team's job is to improve and maintain the "platform" of Ruby software throughout the company: the Rails framework itself, services and modules used by many or all of the product teams at the company, and so on. Our test environment is one of the main responsibilities of this team.
We had a bug report: "We're seeing a ton of 'hang time' in Rack when serving a GraphQL request, and it only happens in the test environment."
What they were seeing was a profile from Datadog that looked a bit like this:
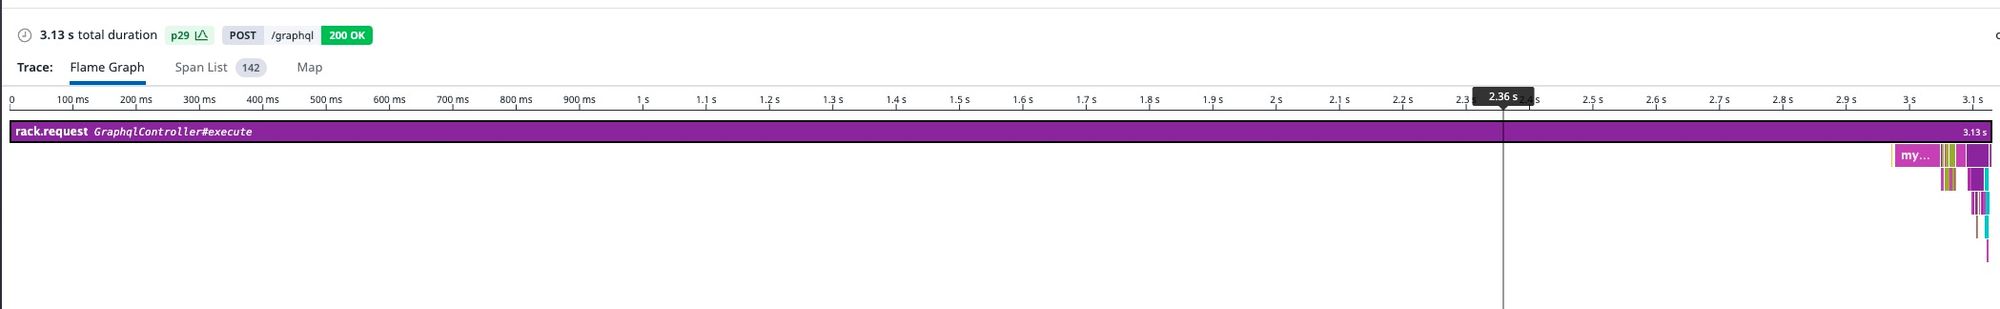
There was lots of time spent "hanging" in a span that was labeled "Rack", with no other details, for each and every GraphQL request they were looking at. This was also definitely not occurring in staging or production - we simply looked at the same flame graphs for those environments and saw they didn't look like this.
Datadog's profiles are created by instrumenting code with timing blocks that look like this:
That starts a new "span", and when we finish with the block we "close" the span. Spans can be nested this way, just like blocks. But since our code (or our libraries) must be instrumented to create new spans, we lose a lot of detail. So, while the span said "Rack" here, I knew already that it could potentially be almost anything. I had seen this kind of report many times before, and knew that all that it told me was that the problem was probably in any of the tens of thousands of lines of code that run before the Rails controller starts running.
Reproducing Locally
The first step of any performance debugging is to reproduce the issue on your own machine. This was pretty simple to do. I simply ran one of our system tests and used an environment variable to toggle some debug output that would print our GraphQL gateway's timings. Those timings confirmed what we saw in Datadog: weirdly long time to respond to a GraphQL request:
What's going on here? Our GraphQL queries don't take 5 seconds to execute - certainly not every single one of them!
At this point, my colleague Josh Nichols had already used a profiling tool, Singed, to get a flame graph.
In a Rails system test, there are actually at least 2 different Ruby processes involved. One process is responsible for sending the request, and the other is responsible for responding to it. Josh had collected a profile for the former - the requestor. He immediately noticed a long period of time being taken in some code related to code reloading. I took a look too, and we both agreed that this was a red herring.
Hypothesis One: Threading
I took a deeper look, and I was pretty sure this was all related to threading. We were making 3 or more requests at the same time for every page, usually for GraphQL responses or otherwise a bunch of JSON API requests to hydrate our React-powered frontend. My hypothesis was that 10 or more requests were being processed by 1 poor worker process which was configured with 15 threads. Thanks to Ruby's GVL, these requests would be processed concurrently, but fairly slowly.
The problem, as I saw it, was like a checkout clerk at a grocery store that started 15 peoples groceries all at once rather than processing 1 cart at a time. That checkout clerk would maybe still process the total of 15 people in the same amount of time while working concurrently, but each individual person in line would have a 15x longer time from when their first grocery item was scanned versus the last, because the checkout clerk cannot actually do their work in parallel.
So, the experiment now was simple: just run the system tests with a single-threaded process responding to the requests, and we should see the GraphQL response time go down to a normal number. The overall slowness of the system test should be the same, but at least the numbers being reported for the latency of each request would be more normal.
Well, it didn't work. The problem persisted.
Hypothesis Two: File Update Checker
At this point, I had two options:
1. Try to get a profile of the GraphQL request itself, which, in retrospect, probably would have been pretty easy if I had just used Josh's profiler frontend library singed.
2. Start investigating the one weird behavior I did see for certain: code reloading checks being really slow.
Of course, I was lazy and chose option 2. In retrospect, I got lucky that this was actually the real issue and it would have been the better choice to go along with option 1.
However, I chose option 2 partly because I had a vague memory of performance problems with file update checkers kicking around in my brain. In a different context at Gusto, the file update checker was taking a large amount of time. I couldn't remember the details or what the fix was, if anything, but I knew I had seen something like this before. Hm, well, let's dig in again.
First, you need to understand what the file update checker does. In the development environment (and, in our case, test too), the Rails config setting cache_classes is set to false. What that does is, instead of "caching" your application's code, Rails checks on every request to see if your code needs to be reloaded or not. This is the config knob that allows Rails to "hot-reload" your code so you don't have to restart your server to see any changes you've made.
In test, we have that set to false. That's actually unusual, because the default nowadays is true. It turns out, we use false here because we want to use Spring in the test environment (which, again, is no longer the default in Rails). So, to accommodate Spring, cache_classes must be false.
In a system test, this means that for every request, we check to see if the code needs to be reloaded or not.
Actually, we have cache_classes set to this:
So, in our CI environment, we cache classes.
Interesting. I asked the original reporter - do we also see this problem in CI? No, in fact we do not.
So now I'm feeling like we're getting warmer. Why would checking if our code needs to be reloaded be so slow in test, but not in development?
Well, it turns out that the way we check to see if code is reloaded - that is, the file_watcher - is configured explicitly in our config/environments/development.rb:
Again, interesting. It makes me wonder - what's the default here? Because it turns out we don't have this line in our test.rb file, which means that in test, we're using whatever the default is.
Bam. So we're using two different file update checkers when running our development environment versus running the tests! So, now all that's left to prove is that the default, FileUpdateChecker, is slower than EventedFileUpdateChecker for us.
I found this old Rails PR where DHH made EventedFileUpdateChecker no longer the default in Rails. John Hawthorn included a nice little benchmark in that PR:
I ran this benchmark with the default FileUpdateChecker: 600ms. Ouch. And, for some reason (which I never did look further in to), it was being called multiple times per request to our GraphQL backend (probably due to requests for a JWT authorization and requests to subgraphs) which meant that our GraphQL backend got super slow in system tests, 1.8 to 2.4 seconds slower than normal!
We had basically fallen through a crack in the Rails default experience: first of all, Gusto's monolith has more than 5 million lines of Ruby code, so anything involving checking lots of files is going to be a "hot path" for us. Second, the EventedFileChecker was made the default in the Rails development environment, but never the test environment, mostly because the EventedFileUpdateChecker was added in Rails 5 and the system tests that caused this issue were added in Rails 6. Nowadays, since Spring is no longer used in the test environment by default, the "cracks" have closed.
So, simply changing our file watcher in the test environment made most of our system tests 40% faster to run locally. However, this was a unique product of many peculiarities of our setup: Spring, 5 million lines of code, and GraphQL being the most relevant.
What We Learned
We can pull a few useful things out of this story:
- Always be profiling. Profiling is such a useful tool, and provides the most detailed information possible regarding what your code is doing.
- Follow leads, even if you’re not 100% certain of them. Don’t prematurely discount any hypothesis without evidence. Sometimes things you thought were red herrings turn out to be the real deal.
- Benchmark to confirm. If you have a hypothesis about performance, the quickest way to prove or disprove it is to come up with a benchmark. This is the fastest possible performance feedback cycle.
I hope you found it as interesting as I did.

